Phase-Shift Full Bridge Transformer Winding Design
One of the most important parts of the design procedure of a magnetic component is to accurately determine the winding losses and their dependency on the frequency. By controlling the disposition of the wires around the magnetic core, a designer can minimize the losses produced by eddy currents in the windings.
The objective of this application note is to introduce the magnetomotive force (MMF) diagrams and to apply them to predict and control the winding losses in a center-tapped transformer.
Magnetomotive Force Diagrams
Many efforts have been made to obtain analytical expressions for calculating the winding's AC resistance. Two of the most commonly used formulas are based on the studies by Dowell (introduced in previous application notes) and Ferreira (based on using Bessel functions of the first kind to solve the problem).
For working with these analytical expressions, all the parameters of the magnetic component winding have to be known, such as the conductors material, dimensions, insulations, or disposition of the wires.
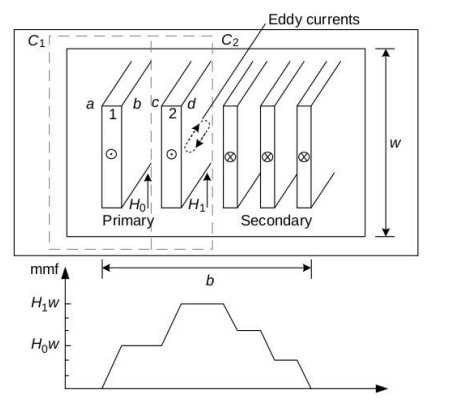
Figure 1. MMF diagram, as found in the book “Transformers and inductors for power electronics”, by W.G. Hurley and W.H. Wölfle.
Focusing on the wire's disposition, it is necessary to determine how the magnetic field intensity is distributed across the winding window, needed for studying the magnitude of the induced eddy currents in the conductors in each winding layer. To simplify this problem, MMF diagrams can be used for showing the field distribution, as described in Figure 1.
Dowell’s principles applied to a center-tap transformer for Phase-Shift Full-Bridge
This doc studies a transformer with a center tap configuration (as shown in Figure 2), placed in a phase-shift full-bridge converter, in which each secondary is going to be working during the whole semi-period.
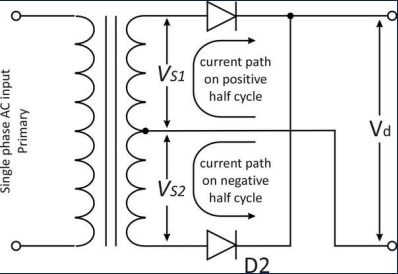
Figure 2. Center-tapped transformer in phase-shift full bridge.
Focusing on the AC resistance calculation, an MMF diagram has to be done for the correct estimation of the winding losses due to the proximity effect. In steady-state, considering the winding distribution of Figure 3.a, a diagram as shown in the black plot of Figure 3.b can be constructed.
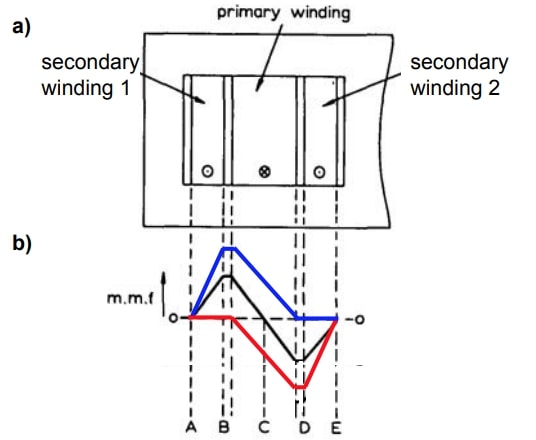
Figure 3. a) Transformer winding distribution. b) Black graph shows the MMF diagram if all the working period is considered. Red and blue graphs show the MMF diagram in each semi-period: in one half of the period will be working the secondary 1 (blue) and in the other half the secondary 2 (red).¹
However, there is a question being raised here: is the constructed MMF diagram a good representation of the magnetic field intensity distribution in the transformer windings, taking into account that each secondary is working during one semi-period? Another two diagrams has been shown in blue and red in Figure 3.b, in which the magnetic field intensity distribution during each semi-period of the operating point is indicated: blue when secondary 1 is conducting and red when secondary 2 is.
Analyzing the different magnetomotive force diagrams, it can be seen that the positive and negative peaks are greater in the red and blue ones.
¹ Adapted from: P. L. Dowell, "Effects of eddy currents in transformer windings," in Proceedings of the Institution of Electrical Engineers, vol. 113, no. 8, pp. 1387-1394, August 1966, doi: 10.1049/piee.1966.0236.
Conclusions
The main conclusion of the previous Dowell’s method case study is that the winding losses due to proximity effects induced in the primary winding would be underestimated because of the different peaks in the MMF diagram.
Dowell’s principles applied to the winding losses calculation at high frequencies are a good way for predicting the real performance of a transformer, but it can be inaccurate in some cases, like the exposed center-tap transformer in a phase-shift converter.
Do you want the full version?
Login or Signup for our newsletter!
